Drawing Layer
The drawing layer is like a collection of these features. You can add descriptive text and upload images to precisely annotate these features. The following type of features can be added to the drawing layer: lines, polygon, line, point, and text.
Polygon Tool
You can edit the styling of a polygon by simply selecting it and changing the fill and stroke color. In addition, you can also change the width of the stroke.
Prerequisites: In the following procedure steps, it is assumed that you have accessed a workspace page, selected a new or existing drawing layer, and now you are ready to edit the feature.
To edit a polygon feature, do the following:
-
Open a Workspace, click the Edit icon on the Analyst Tools, and then click the Select tool.
-
Click the polygon that you want to edit.
The Properties panel is displayed.
-
In the Properties panel, do the following:
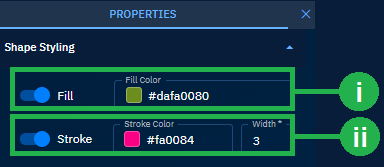
i. Edit the Fill Colour field to select a new colour of the point or copy-paste a hexadecimal (HEX) color.
ii. Edit the Stroke Color field to select a colour of the point or copy-paste a hexadecimal (HEX) color and then proceed to increase or decrease the width of the stroke (boundary) in the Width field.
-
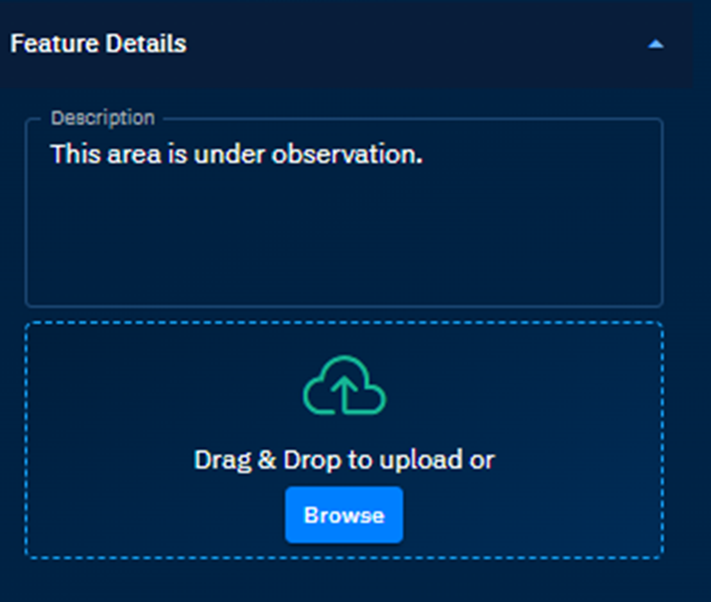
Change the description of the point in the Description field.
-
Click the Browse button to upload a new graphic or photo to add a visual description of the point.
Line Tool
You can edit the styling of a line by simply selecting it and changing the stroke color and the width. In addition, you can also change the line start, line end, and stroke style.
Prerequisites: In the following procedure steps, it is assumed that you have accessed a workspace page, selected a new or existing drawing layer or vector layer, and now you are ready to draw or insert a feature.
To edit a line, do the following:
-
Open a Workspace, click the Edit icon on the Analyst Tools Ribbon, and then click the Select tool.
-
Click the line that you want to edit.
The Properties panel is displayed.
-
In the Properties panel, do the following:
i. Click the Stroke Color field to select a colour of the point or copy-paste a hexadecimal (HEX) color and then proceed to increase or decrease the width of the stroke (boundary) in the Width field.
ii. Select an appropriate start and end line terminators from the Line Start and Line End drop-down list. Then proceed to select a stroke style from the Stroke Style drop-down list.
Point Tool
In the drawing layer, you can draw or insert two types of point: point and symbol.
Point
A point is a geolocation that you can draw or insert on the map. You can increase the point size and the color.
Prerequisites: In the following procedure steps, it is assumed that you have accessed a workspace page, selected a new or existing drawing layer or vector layer, and now you are ready to draw or insert a feature.
To edit a point, do the following:
-
Open a Workspace, click the Edit icon on the Analyst Tools Ribbon, and then click the Select tool.
-
Locate the point and then click and drag a point to change its location.
-
In the Properties panel, do the following:
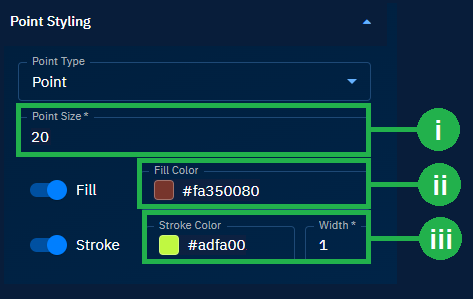
i. Type a number to increase or decrease the size of the point in the Point Size field.
ii. Click the Fill Colour field to select a colour of the point or copy-paste a hexadecimal (HEX) color.
iii. Click the Stroke Color field to select a colour of the point or copy-paste a hexadecimal (HEX) color and then proceed to increase or decrease the width of the stroke (boundary) in the Width field.
-
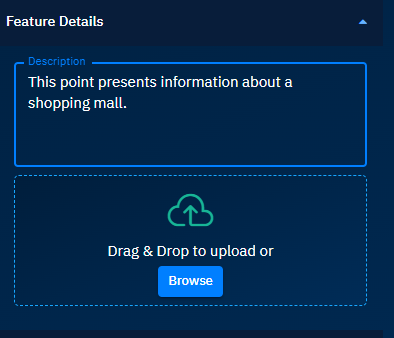
Change the description of the point in the Description field.
-
Click the Browse button to upload a new graphic or photo to add a visual description of the point.
Symbol
A symbol – as the name suggests – depicts a specific location on the map with a symbol. For example, airport, amusement park, bank, and so on.
To edit a symbol, do the following:
-
Open a Workspace, click the Edit icon on the Analyst Tools Ribbon, and then click the Select tool.
-
Locate a symbol (or symbols) and then click and drag a symbol to change its location.
-
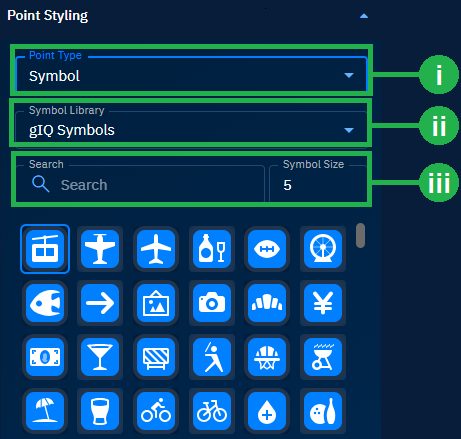
In the Properties panel, do the following
i. Locate a symbol that you want to change, click the symbol, search the symbol and then proceed to click it to drop the symbol on the map. In addition, change the size of the symbol.
ii. Locate a symbol that you want to change, click the symbol, scroll down and select a symbol that you want to insert.
-
Change the description of the symbol in the Description field.
-
Click the Browse button to upload a new graphic or photo to add a visual description of the point.
Text
In case you want to insert short descriptions for specific locations, you can use the text feature. In addition, you can style the text feature to ensure that it displays information in an appropriate format.
To draw a symbol, do the following:
-
On the Analyst Tools, click the Pencil icon and then click the Text Tool icon to activate the feature.
-
Locate a place on the map (where you want to draw a point) and then click on the map to insert the text.
The Properties panel is displayed.
-
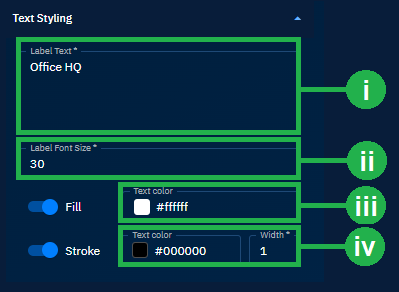
In the Properties panel, do the following:
i. Type the text that you want to insert in the Label Text field.
ii. Increase or decrease the font of the text in the Label Font Size field.
iii. Click the Fill Colour field to select a colour of the point or copy-paste a hexadecimal (HEX) color
iv. Click the Stroke Color field to select a colour of the point or copy-paste a hexadecimal (HEX) color and then proceed to increase or decrease the width of the stroke (boundary) in the Width field.
-
Type description of the point in the Description field.
-
Click the Browse button to upload a graphic or photo to add a visual description of the point.